
In the beginning of class, our teacher told us to type for 30 minutes. Here is my progress in typing for the past 2-3 months.
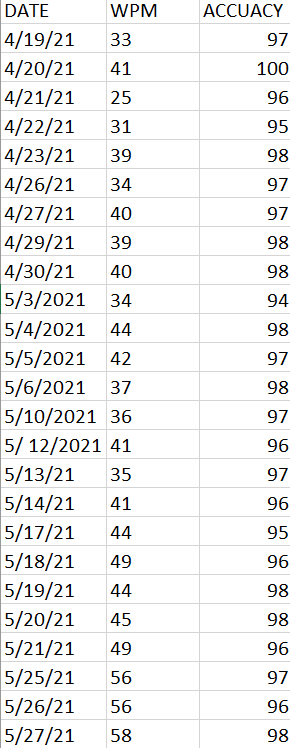
Here are my typing results. This chart/graph is based on my WPM( words per minute), and accuacy. For the chart, the left side is the date. It records the day that I did my typing on. Then, the chart have WPM, and accuacy.
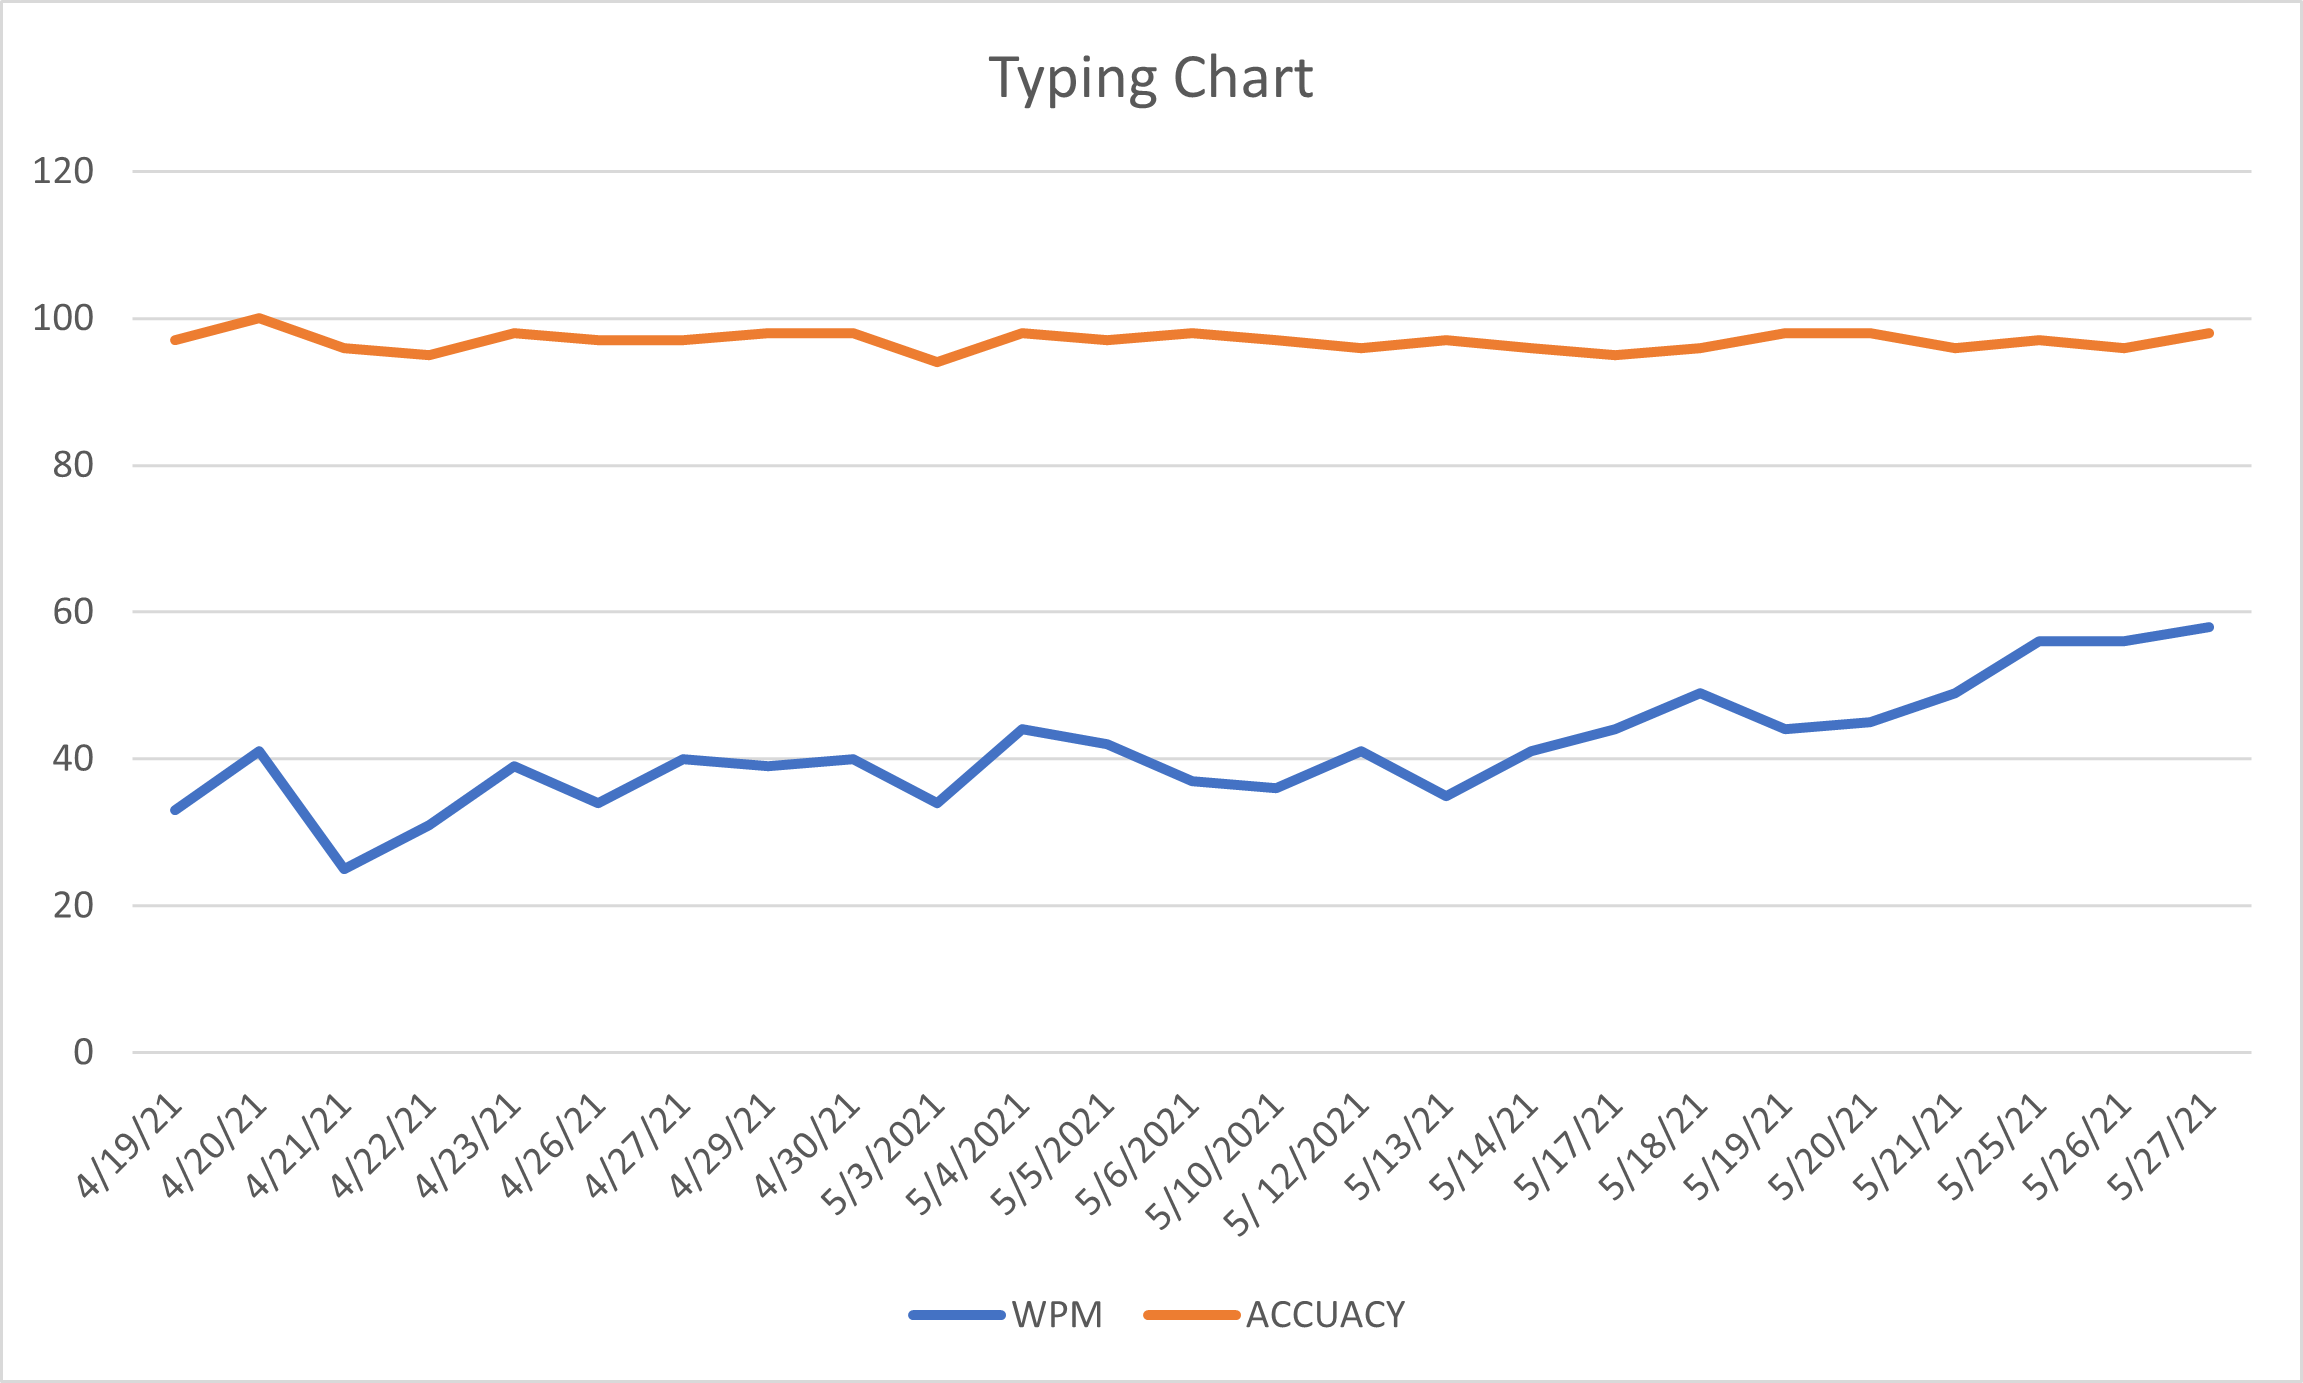
The graph just lets me see the graph from of chart. It lets me visualize the accuacy and the WPM in my head.
You could see that my typing speed started below 35 WPM, but at the end, My WPM is now close to 60WPM. You could see my improvement in my typing speed. My accuacy went up just by a pinch but that was a good thing that my accuacy was stable.
 |
 |
 |
 |
 |